


Christian County Library uses a survey company called Net Promoter to tell its library’s story. Here is the website of Orange Boy.
In this video from the October 2024 Board Meeting, the Marketing Director presents his findings from the NPS survey.
I didn’t know much about a Net Promoter Survey, thought speaking with Deborah helped. So I had to research. I went to Claude.AI (which can be an excellent teacher) and asked two questions.
What are the limitations of a NPS survey? Since it only asks one question [about satisfaction] and asks fewer and fewer clients/customers each time, doesn't it present a rosier picture of data than is actually present in the community about a business?
It answered:
Let me analyze the key limitations of Net Promoter Score (NPS) surveys:
The single-question limitation creates several issues:
1. It fails to capture why customers feel the way they do, making it difficult to take specific action on feedback
2. It doesn't distinguish between different aspects of the customer experience (e.g., product quality vs. customer service)
3. The question measures intent ("would you recommend") rather than actual behavior, which can differ significantly
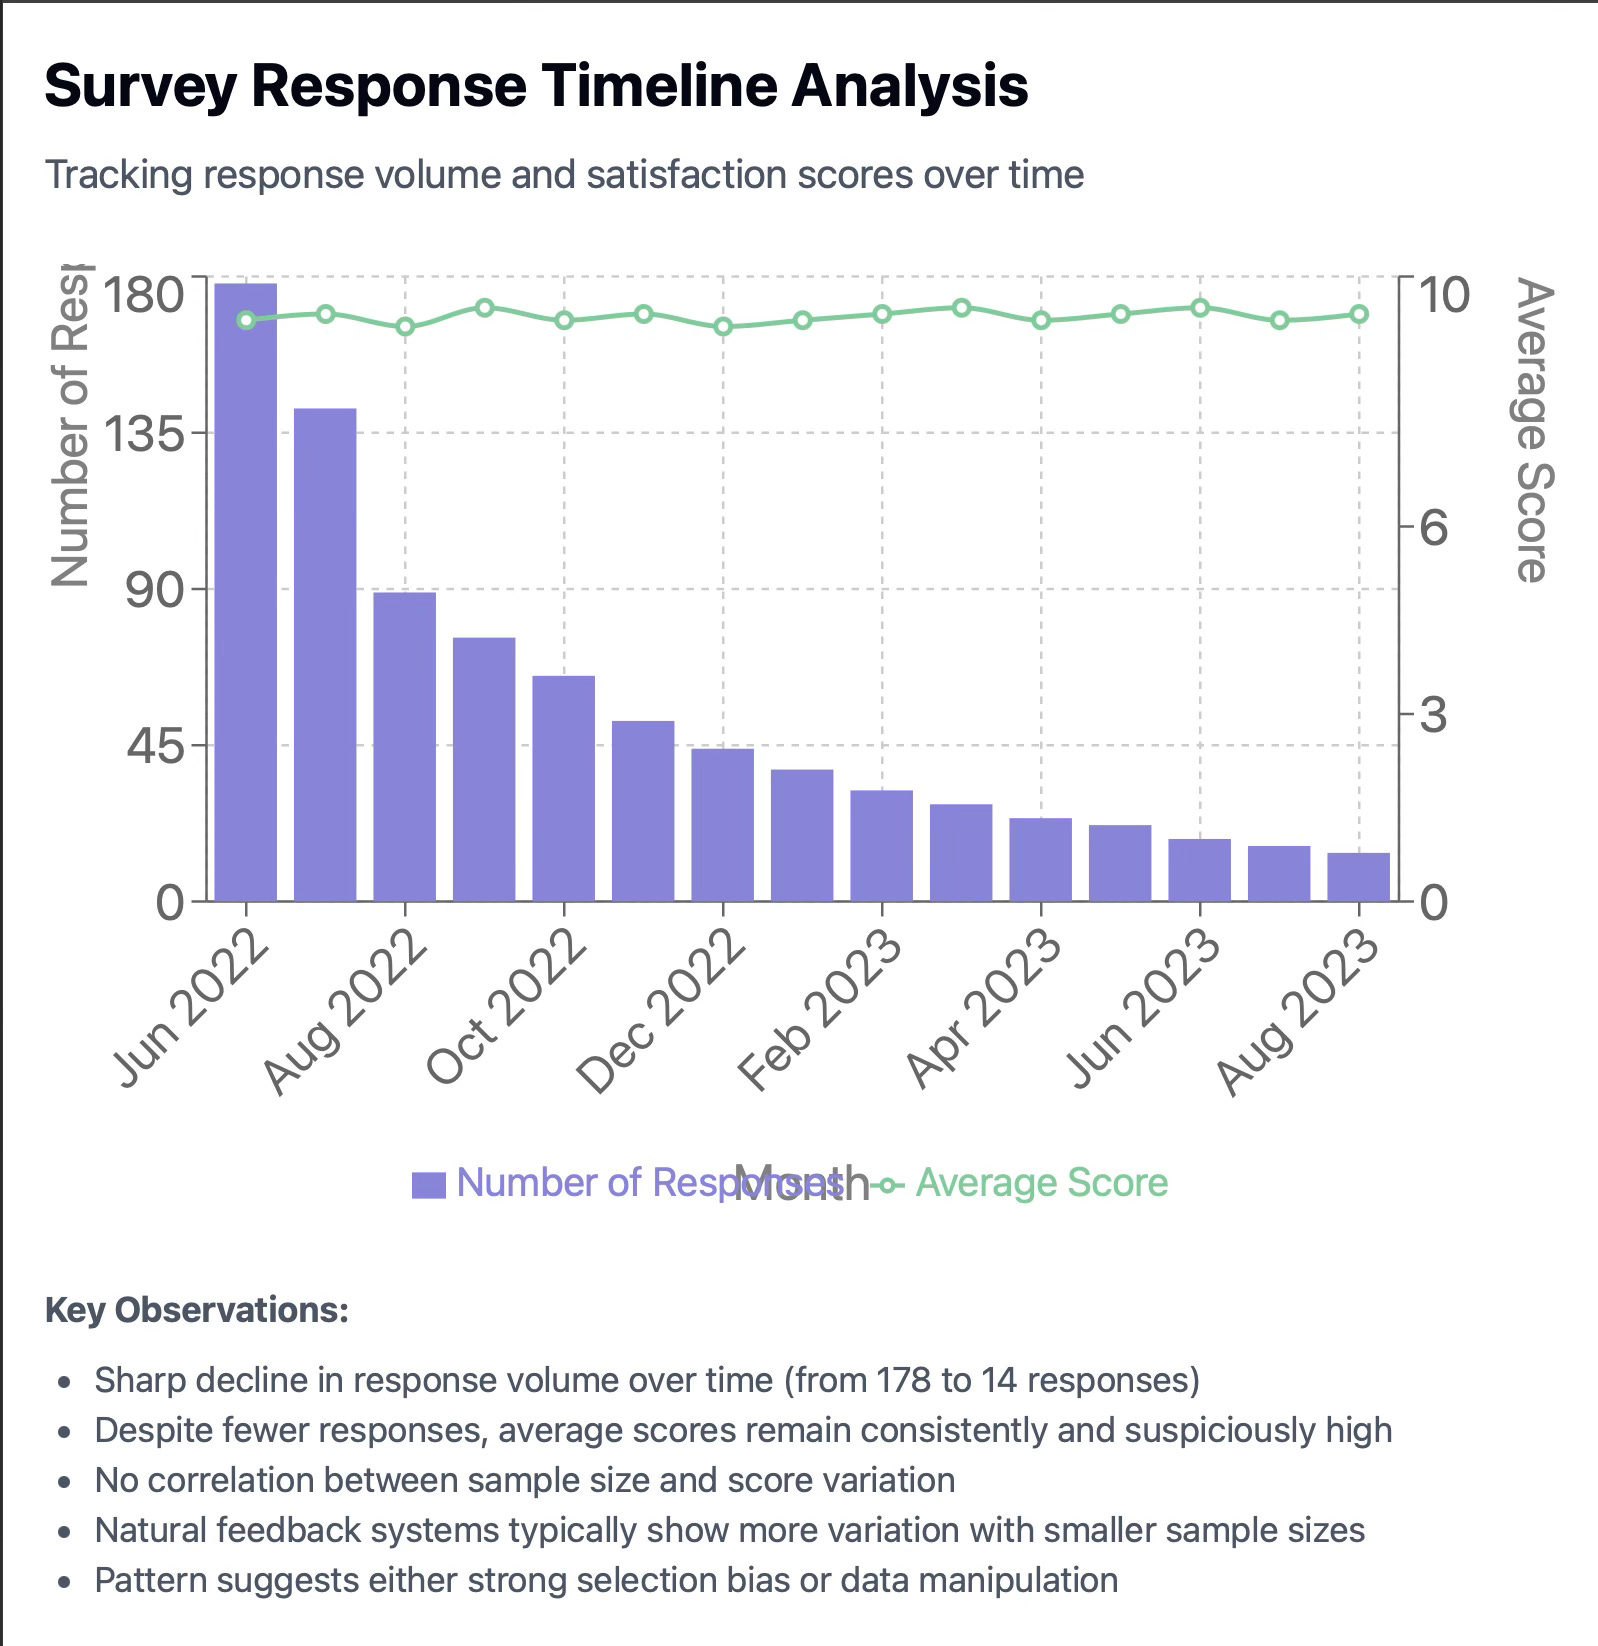
Your observation about declining response rates over time is important and can indeed create bias:
- Customers with strong feelings (either very positive or very negative) are more likely to respond, creating response bias
- If satisfied customers are more likely to respond to repeat surveys, this can artificially inflate scores over time
- The "silent majority" of moderately satisfied or dissatisfied customers may be underrepresented
Additional limitations include:
- Cultural differences in how people rate numerical scales can make international comparisons unreliable
- The arbitrary grouping of scores (0-6 detractors, 7-8 passives, 9-10 promoters) may not reflect meaningful differences in customer sentiment
- The metric doesn't account for industry context - what's considered a good NPS score varies significantly across sectors
Would you like me to elaborate on any of these points or discuss potential solutions to address these limitations?
Can you write up a summary of why NPS surveys are designed to hide bad community metrics for a library system that is facing backlash in the community? I've uncovered a Sunshine Report showing a library using this data, but I want an analysis of how NPS reports aren't effective and can hide data. [I was expecting a short answer. I was even worried it would come back with a woke answer about Libraries being misunderstood in today’s political climate.]
Analysis: How NPS Surveys Can Mask Negative Community Sentiment in Library Systems
Structural Limitations of NPS in Public Services
Net Promoter Score surveys have inherent limitations that make them particularly problematic for measuring public library satisfaction, especially during periods of community controversy:
Selection Bias and Response Patterns
1. Active Library Users vs. General Public
NPS typically only captures responses from active library users
Excludes community members who have stopped using the library due to dissatisfaction
Misses input from taxpayers who fund but don't use library services
2. Frequency Bias
Regular patrons (likely more satisfied) are oversampled
Dissatisfied former users are systematically excluded
Creates an echo chamber of positive feedback
[Concerns Deborah and I spoke to in our interview.]
Data Collection and Representation Issues
1. Single Metric Oversimplification
Reduces complex community concerns to a single number
Obscures specific areas of dissatisfaction
Cannot capture nuanced feedback about controversial issues
2. Timing and Distribution Effects
Surveys are often conducted during peak usage times
May miss seasonal users or those with limited access
Can be inadvertently (or intentionally) timed to avoid periods of controversy
[The one question about satisfaction can be misleading. “On a scale from 0 (not at all) to 10 (very), how likely are you to recommend the Christian County Library to others?” This doesn’t allow for further probing of new account holders as they mature or leave the system in disgust.]
These are the follow-up questions to the first question about Overall Satisfaction on the Survey:
Please explain your score:
We are interested in learning what needs the library meets in the community.
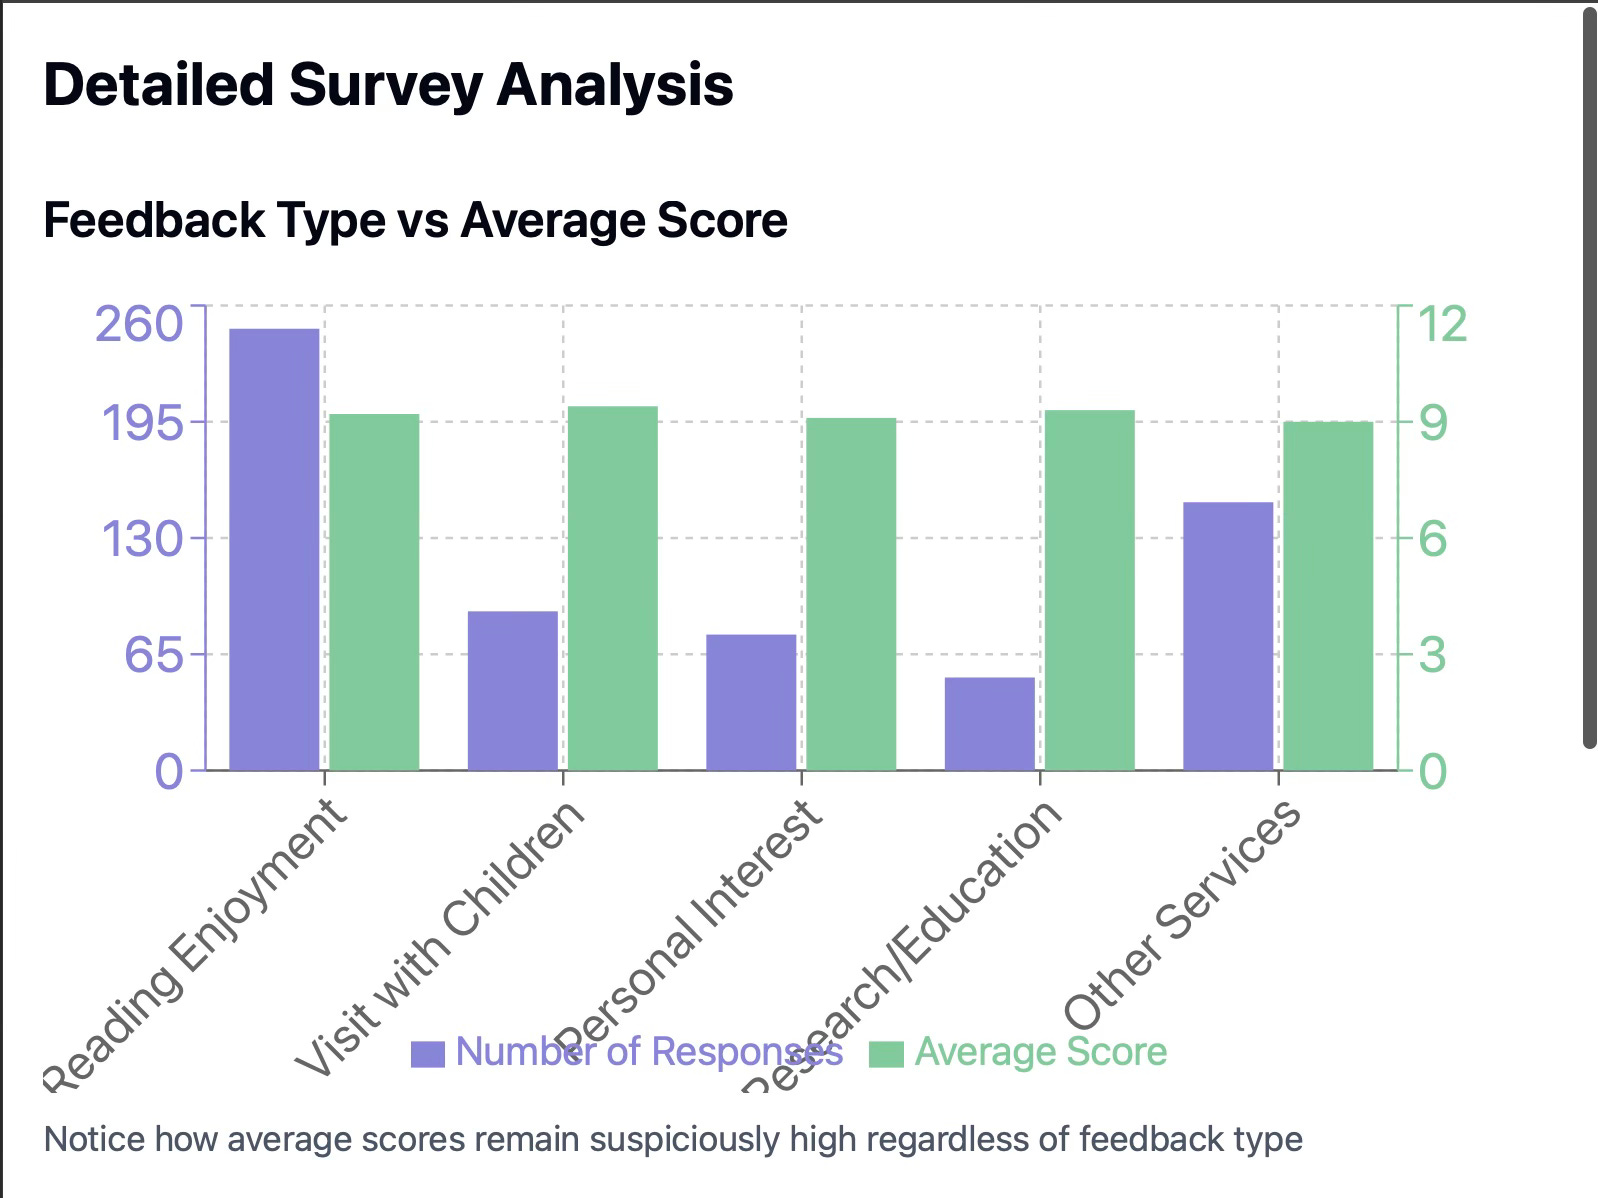
When you used the library, what need were you seeking to fill? Please select the option that best applies. Other (please specify):
We are interested in learning what needs the library meets in the community.
When you used the library, what need were you seeking to fill?
Please select the option that best applies. The quality of service met or exceeded expectations.
Please respond to the following statements about your most recent library experience.
Staff responded to my needs in a timely fashion.
Please respond to the following statements about your most recent library experience.
Communication about services was effective.
Please respond to the following statements about your most recent library experience.
Staff treated me with courtesy and respect.
Please respond to the following statements about your most recent library experience.
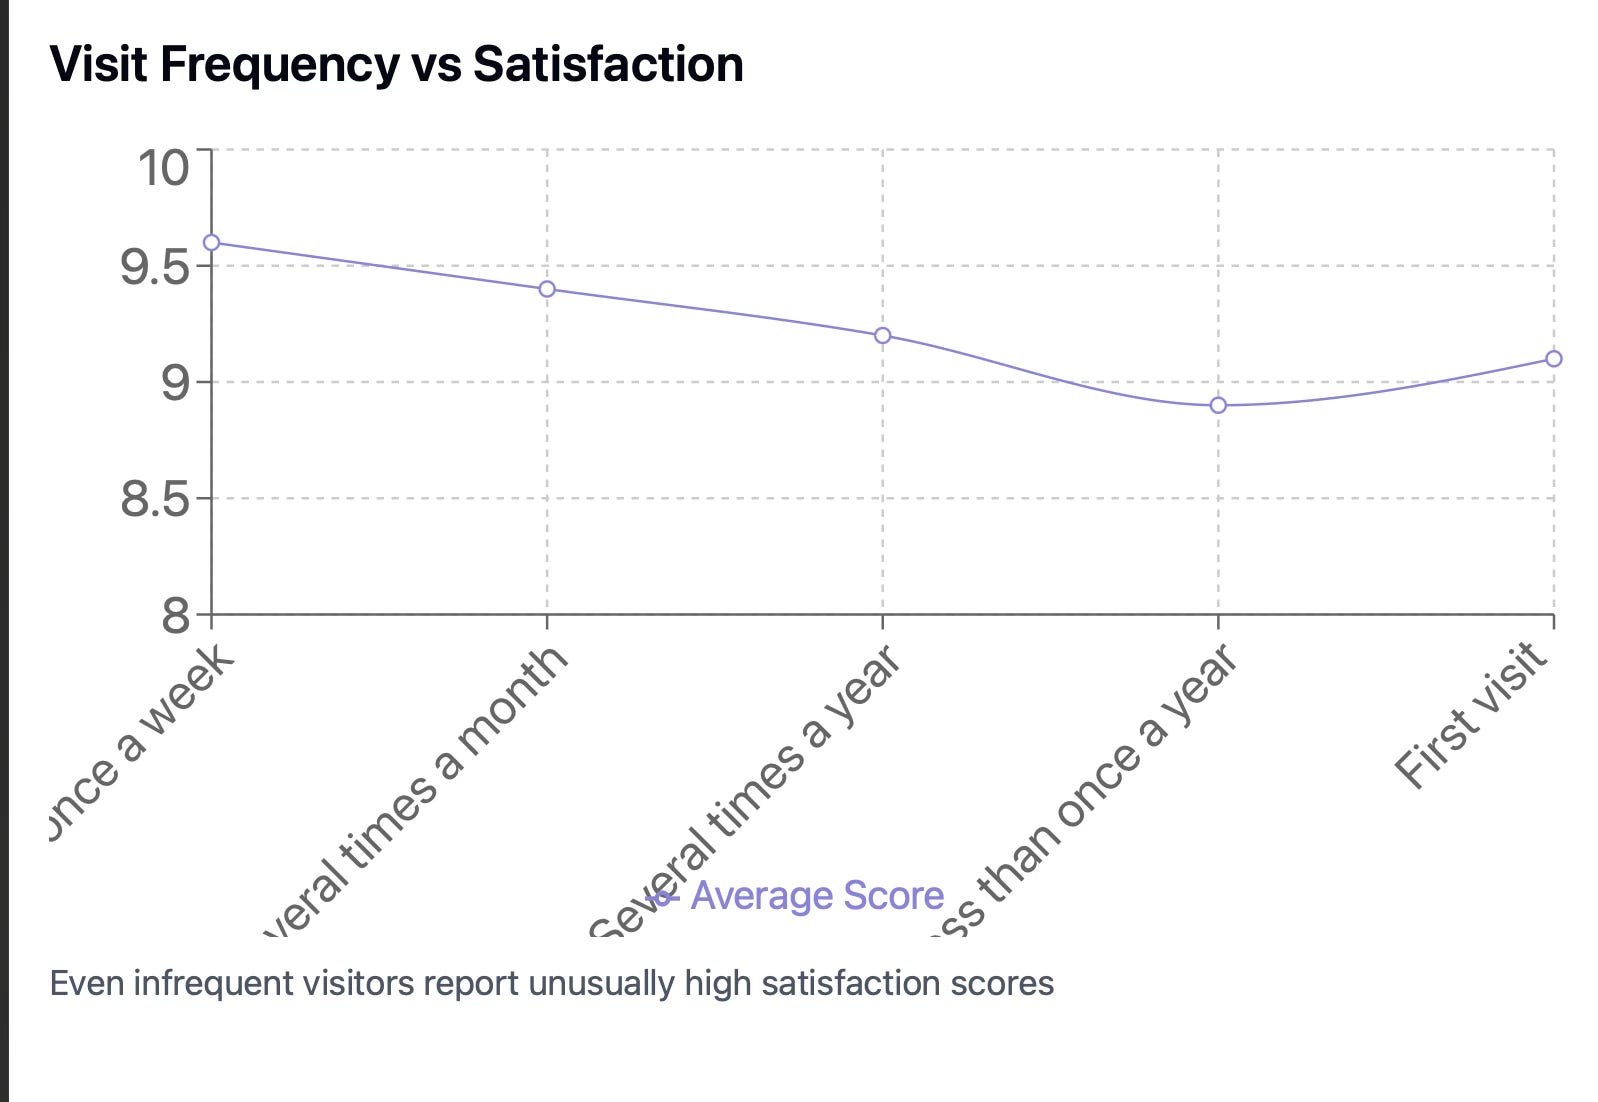
How often do you visit the library?
How did you learn about the service you used?
Other (please specify):
How did you learn about the service you used?
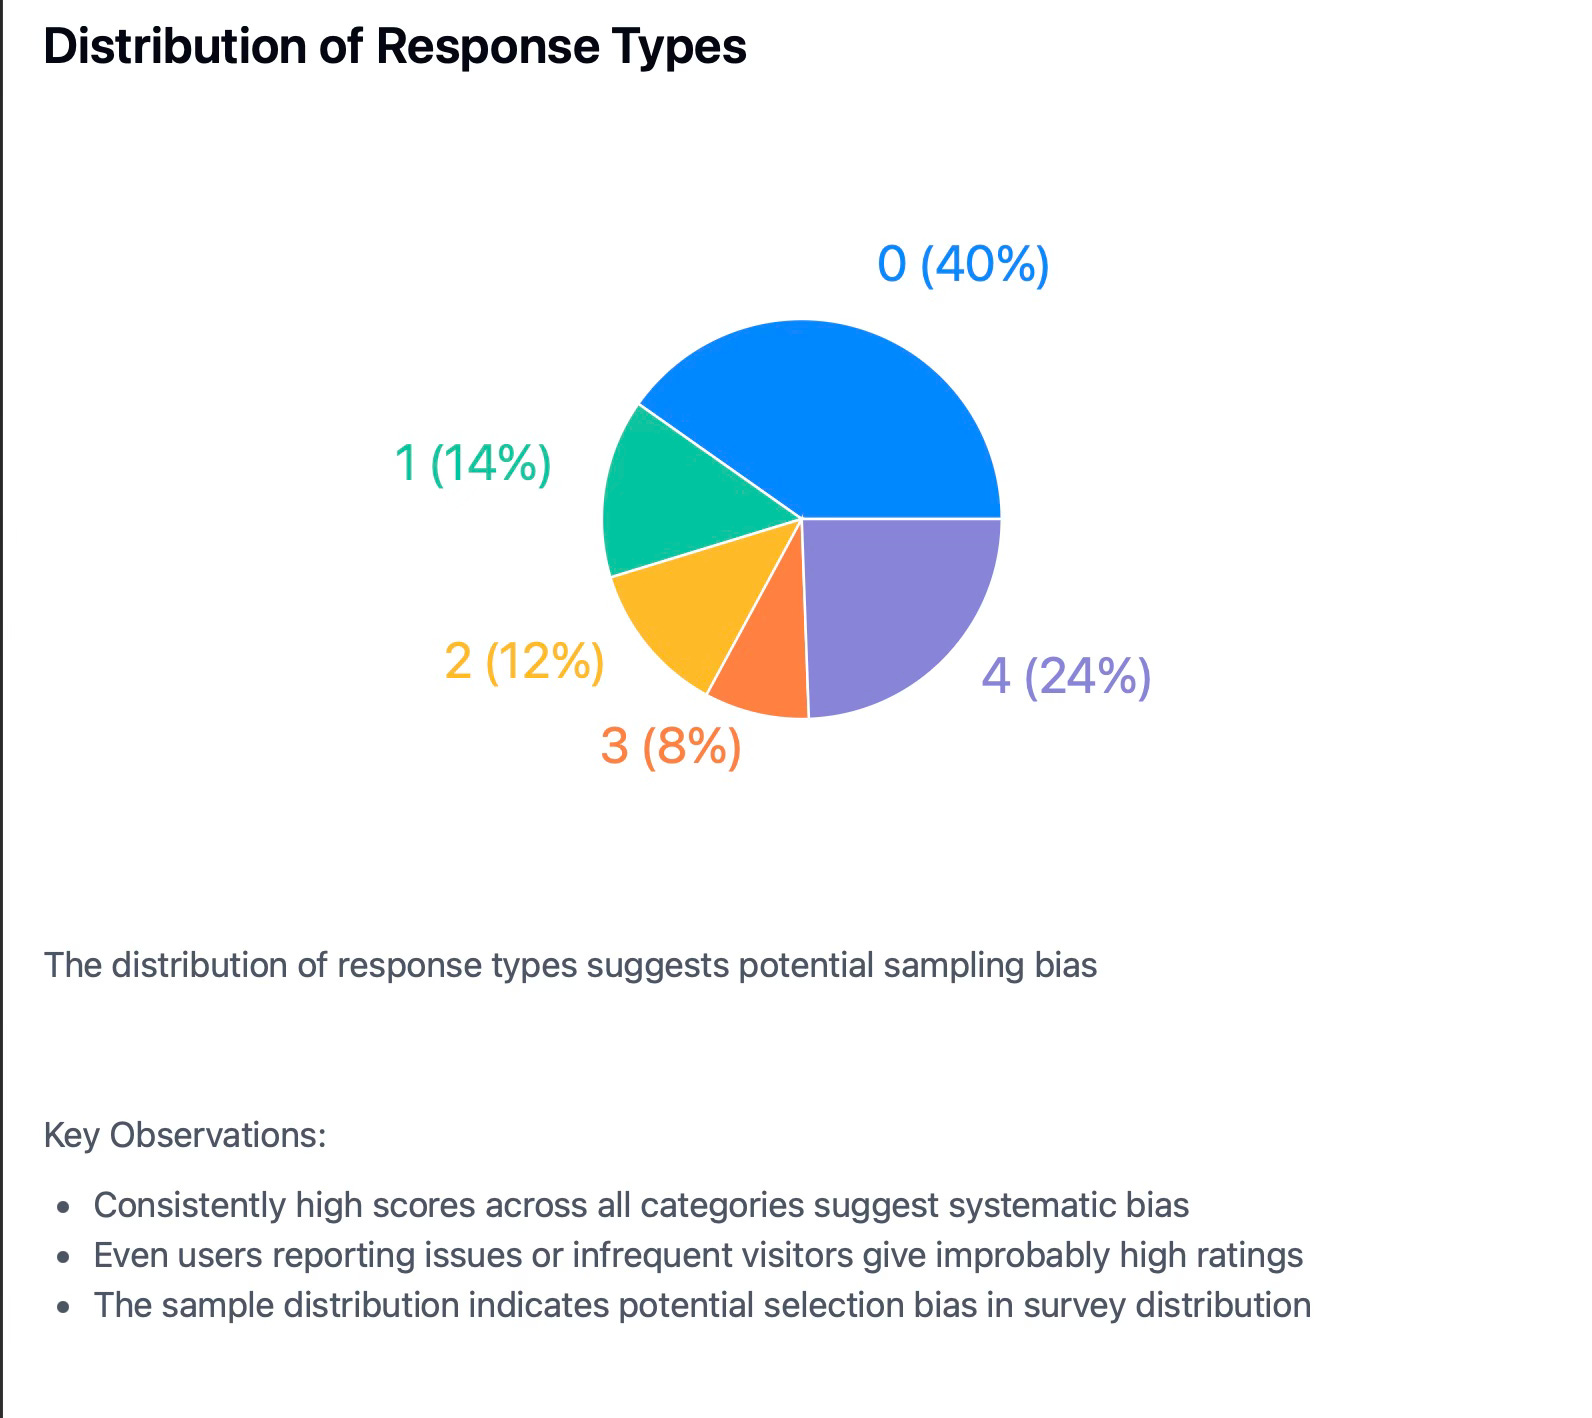
The respondents scored the Library. These are the scores they chose by percentage (1-4). “0” indicates no response to the question, I believe.
How NPS Can Mask Real Issues
Mathematical Distortion
1. Score Calculation
Detractor scores (0-6) are grouped together, minimizing the impact of extremely negative responses.
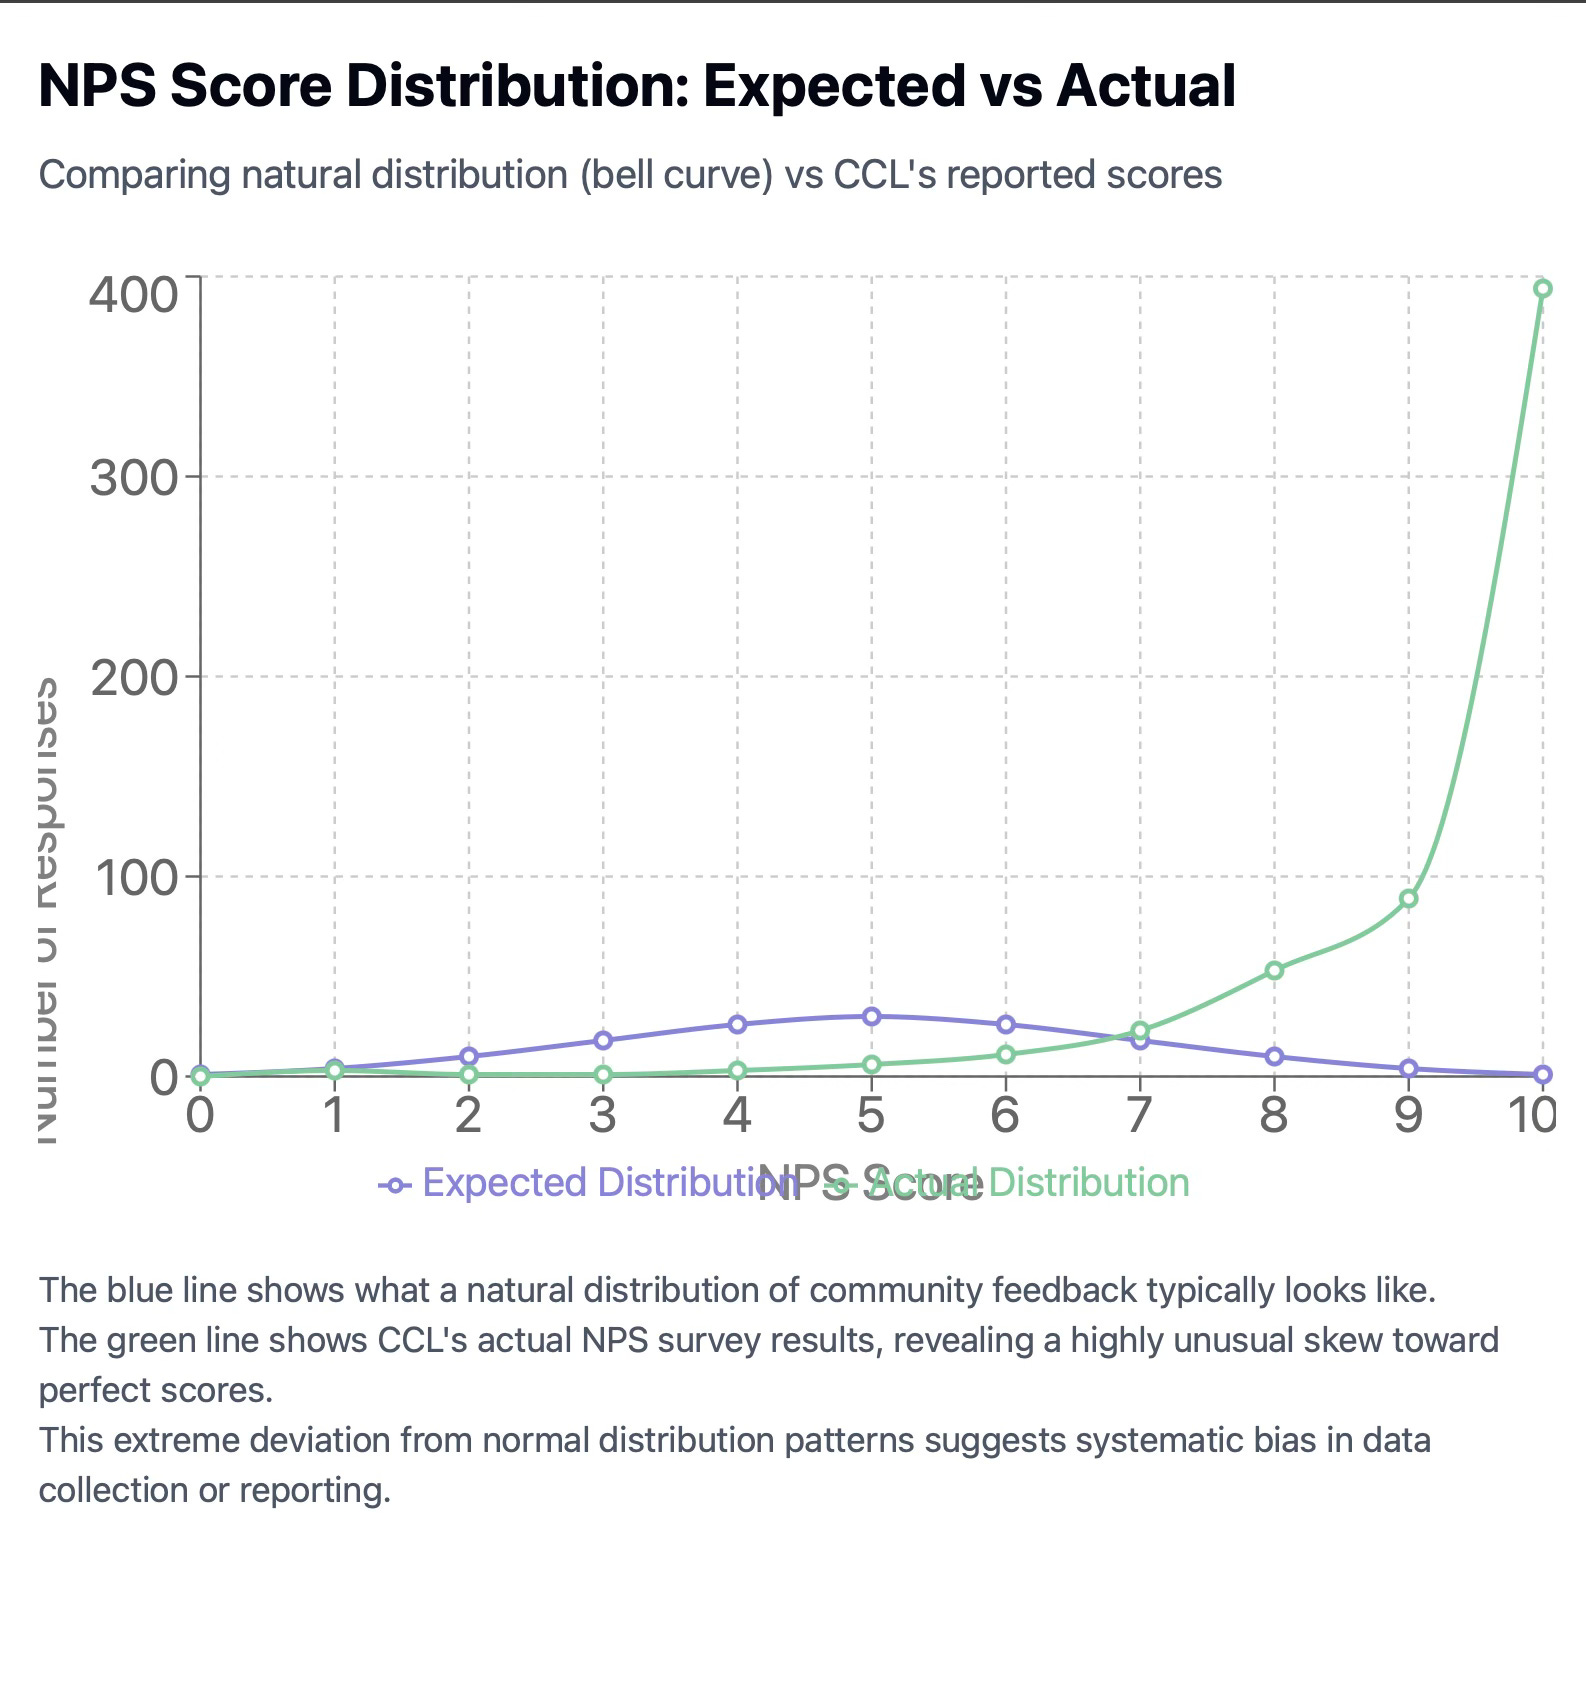
[Only 25 scores are under 6 out of 614? 536 scores are “8” and above, with most of those being “10.” In reading the scores, I saw one patron complain about pornography for youth but still rated the library at an 8. Only one patron listed the library at a six, talking about antithetical values. These scores are too good. There should be a bell curve distribution of opinion. Anonmolous scores like this are curated in an environment where the community shows up to boring Library Board meetings demanding Library Board members leave and hundreds of Facebook commenters agree with the removal of sexually explicit material from the Library for children.]
Passive scores (7-8) are eliminated from the final calculation
This methodology can make significant negative sentiment appear less severe
[If this is so, this is padding the numbers to hide true dissatisfaction. No wonder CCL wants to use a survey like this and then bring it out to tout their highly satisfied user numbers. It’s misleading.]
2. Percentage Manipulation
Final scores represent net differences rather than absolute satisfaction levels.
A library could have 40% detractors but still show a positive NPS if promoters are slightly more numerous.
This masks the actual volume of dissatisfied community members
[Again, misleading data.]
Context Elimination
1. Loss of Specific Feedback
No capture of reasons for dissatisfaction
Cannot track specific policy or service complaints
Eliminates context for community concerns
[We never learn why people are dissatisfied and never know what to address based on the first carefully curated question by CCL.]
2. Missing Demographic Information
No correlation between satisfaction and community segments
Cannot identify underserved or dissatisfied populations
Masks equity issues in service delivery
[What age groups? What backgrounds? What faiths are dissatisfied with the Library?]
Administrative Implications
Reporting Vulnerabilities
1. Selective Data Presentation
Can cherry-pick survey periods with better scores
Ability to exclude "outlier" responses
Can present trending data that obscures periodic dissatisfaction
[They can send out surveys when they know families are too busy to respond.]
2. Benchmark Manipulation
Lack of standardized benchmarks for public libraries
Can compare against inappropriate peer institutions
Ability to set arbitrary success thresholds
[They can determine an appropriate threshold for “successful” libraries. No one has determined what a happy library looks like, but as the Marketing Director stated, we have one.]
Policy Impact
1. False Positive Feedback Loop
Positive NPS scores can be used to justify controversial decisions
May delay necessary policy changes
Can create artificial support for administrative decisions
[We can put any book in the collection we want. The data supports the librarians. Even if we curated the question, the data, and the threshold for what it should look like. The data is reliable as long as you squint hard enough.]
2. Resource Allocation
May justify reducing community engagement efforts
Can mask need for service improvements
May impact funding decisions inappropriately
[We are happy, happy, happy. So we need more tax bond money at our library.]
Documentation and Transparency Concerns
Data Accessibility
1. Limited Raw Data
NPS typically reports only final scores
Original response data is often not preserved
Difficult to audit or independently analyze
[What does their raw data look like?]
2. Methodology Opacity
Survey distribution methods often unclear
Response rate calculations may be obscured
Sampling methodology rarely documented
[Deborah spoke to this in the interview. She found one email for a survey. I don’t remember getting one, but my junk filter is high. How many people have their surveys dumped into junk mail?]
Public Record Implications
1. Incomplete Public Record
May not meet public institution documentation requirements
Difficulty in Sunshine Record Request effectively
Limited usefulness for public oversight
[The Library has a history of Sunshine Record Request difficulties if not outright violations. However, they complied this time.]
2. Historical Tracking
Difficult to compare across time periods
Cannot track specific issue resolution
May not maintain adequate response records
[How do we know that patrons feel heard and their satisfaction has improved when the number of patrons surveyed dwindles every time the survey has been sent out?]
Recommendations for Public Oversight
1. Documentation Requirements
Mandate preservation of raw response data
Require documentation of methodology
Maintain records of all survey periods
[Where are the good records?]
2. Supplemental Metrics
Implement multiple satisfaction measures
Require qualitative feedback collection
Maintain comprehensive community feedback systems
[Why aren’t there various types of surveys? Is it a money issue? Or a priority issue?]
3. Transparency Measures
Regular public reporting of complete data
Clear methodology documentation
Active community engagement processes
[The board meetings over the last two years should be an indicator of public dissatisfaction, but that wasn’t included.]
Conclusion
The Christian County Library Board needs to direct the Interim Executive Director, Dana Roberts, to suspend this Net Promoter Survey. It doesn’t collect meaningful data from the community. Still, it uses valuable taxpayer funds (which CCL is running out of due to mismanagement by the previous executive director) to misrepresent how satisfied the community is with the library.
Orange Boy isn’t offering a qualitative survey system for libraries. It’s offering a PR Damage Control System for Libraries. This system is used to either justify the need for larger tax bonds in the community or to control the narrative when Librarians are called to task for failing to respond to community complaints. They massage the data for the client and allow the librarians to present a public relations face to the community: cheap makeup and fake teeth.
They are taking your money to tell you how great they are about taking your money. This survey from Orange Boy is designed to tell you a story, a narrative. However, it’s not a good story, and the Marketing Director at CCL is not Shakespearean in expressing an epic. It’s more of a wake modern comedy—buy our brand because we are woke, and we deserve your money because we are woke.
Do you want a Library system that serves and meets your family's needs or a Library system that surveys all they see as their domain, including your children?


Share this post